Electrical Resistance Tomography for Concrete Non-Destructive Testing
Reinforcing steel, cracks, moisture gradients and chloride distributions in concrete all create conductivity contrast — the physical basis that lets Electrical Resistance Tomography (ERT) image the interior of concrete in 3D. Based on Karhunen et al. (2010) in Cement and Concrete Research, this article introduces the principle, experiments and results of ERT for concrete NDT, and the outlook for rebar localisation, crack-depth estimation and moisture mapping.

Follow us on WeChat
Scan with WeChat to follow for product updates and technical articles.
TL;DR
Rebar, cracks, moisture and chloride distributions in reinforced concrete all create conductivity contrast — the physical basis that lets Electrical Resistance Tomography (ERT) image the interior of concrete in 3D. In a study published in Cement and Concrete Research (2010), Karhunen et al. used 16-electrode ERT to localise polyurethane blocks, steel bars and plastic plates (crack simulants) inside concrete specimens, demonstrating ERT as a feasible tool for non-destructive evaluation of concrete structures.
I. Why electrical methods for concrete
Much of the concrete infrastructure (bridges, dams, buildings) was built in the mid-20th century and is steadily deteriorating. Engineers need non-destructive methods for early detection of:
- Rebar location and concrete-cover thickness
- Cracking
- Chloride ingress (which drives reinforcement corrosion)
- Moisture distribution
- Corrosion state of reinforcement
Electrical methods (AC impedance spectroscopy, etc.) have long characterised concrete, but conventional impedance spectroscopy yields only bulk parameters without spatial information. ERT’s value: upgrading electrical measurement to 3D imaging — reconstructing the internal conductivity distribution to localise defects.
II. Why concrete can be imaged by ERT
ERT injects current through surface electrodes and measures voltages to reconstruct internal conductivity. Imaging requires conductivity contrast, which reinforced concrete provides naturally:
| Feature | Conductivity | Contrast |
|---|---|---|
| Rebar / steel fibres | Metallic, very high (~10⁵ S/cm) | Far above concrete |
| Cracks, voids | Insulating (dry) or high-resistivity | Far below concrete |
| Moisture gradients | Water raises conductivity | Varies with moisture |
| Chloride distribution | Salt is conductive | Higher in enriched zones |
Background concrete conductivity is about 0.2–0.67 mS/cm (resistivity ~15–35 Ω·m when water-saturated, per McCarter et al.). Rebar and cracks differ by orders of magnitude — the physical condition for ERT is met.
III. ERT principle and the inverse-problem challenge (brief)
ERT is a diffuse (soft-field) tomography: current does not travel in straight lines like X-rays but diffuses through the volume, making the inverse problem ill-posed (non-unique, sensitive to noise and modelling errors). See Soft field and ill-posedness in tomography.
The study used:
- Complete electrode model with a finite-element (FEM) forward solver
- Bayesian inversion with prior models (anisotropic smoothness, logarithmic parametrisation) for regularisation
- Simultaneous reconstruction of contact impedances — essential because concrete–electrode contact impedances vary widely
For metal-containing specimens, the contrast spans orders of magnitude, so logarithmic parametrisation (reconstructing ln σ) is used, allowing large conductivity variations with an implicit positivity constraint.
IV. Experiments: four representative inclusions
Four cylindrical concrete specimens (15 cm diameter, 3 cm tall) were cast and measured nine days after casting:
| Case | Inclusion | Simulating |
|---|---|---|
| 1 | Polyurethane block (insulating) | Voids / low-conductivity inclusions |
| 2 | Vertical steel bar (Ø3 cm) | Main reinforcement |
| 3 | Horizontal steel bar (Ø1 cm, 7 cm long) | Rebar |
| 4 | Two plastic plates (6 cm / 3 cm wide, 2 mm thick) | Cracks |
Setup: 16 electrodes equally spaced around the cylinder; Cu-CuSO₄ wet electrodes (sponge + copper-sulphate solution) for contact; sinusoidal excitation 1 mA @ 1 kHz; current injected through 8 opposite electrode pairs; voltages measured between adjacent electrodes — 128 measurements per specimen.
V. Results and key findings
- Case 1 (polyurethane): The low-conductivity region (~0–0.05 mS/cm) was localised; background concrete was 0.2–0.44 mS/cm, matching the literature.
- Cases 2/3 (steel bars): Position and size of the bars were localised well; however, the steel conductivity was substantially underestimated (actual ~10⁵ S/cm, reconstructed peak only ~1.5 mS/cm). Two reasons: ① the steel–concrete contact impedance was not modelled; ② boundary voltages saturate at extreme contrast — 2 and 20 mS/cm cannot be distinguished, but a 20 mS/cm inclusion in a 2 mS/cm background is detectable.
- Case 4 (plastic plates): The different depths of the two plates were distinguished — indicating ERT can estimate crack depth in concrete.
- Limitations: With a single electrode layer, depth suffers from symmetry ambiguity; absorption of the CuSO₄ electrode solution by concrete creates a high-conductivity artefact near the boundary.
VI. Outlook
Potential construction-industry applications of ERT identified in the paper:
- Concrete-cover thickness measurement over reinforcement
- Crack-depth estimation
- Moisture distribution monitoring
- Reinforcement corrosion-rate diagnosis (combined with rebar location)
Future directions include single-sided measurement (electrodes on one face of a slab, more field-friendly) and complex admittivity imaging (incorporating phase shifts to separate capacitive effects).
VII. Summary
ERT upgrades electrical measurement from “bulk parameters” to “internal 3D distribution”, suiting concrete with its multiple conductivity contrasts. Quantitative estimation of metal conductivity remains challenging, but qualitative or semi-quantitative tasks — locating rebar, detecting cracks, tracking moisture — are feasible, offering a non-invasive route for health monitoring of bridges, dams and buildings.
VIII. Application scenario: long-term moisture monitoring of desert pile foundations
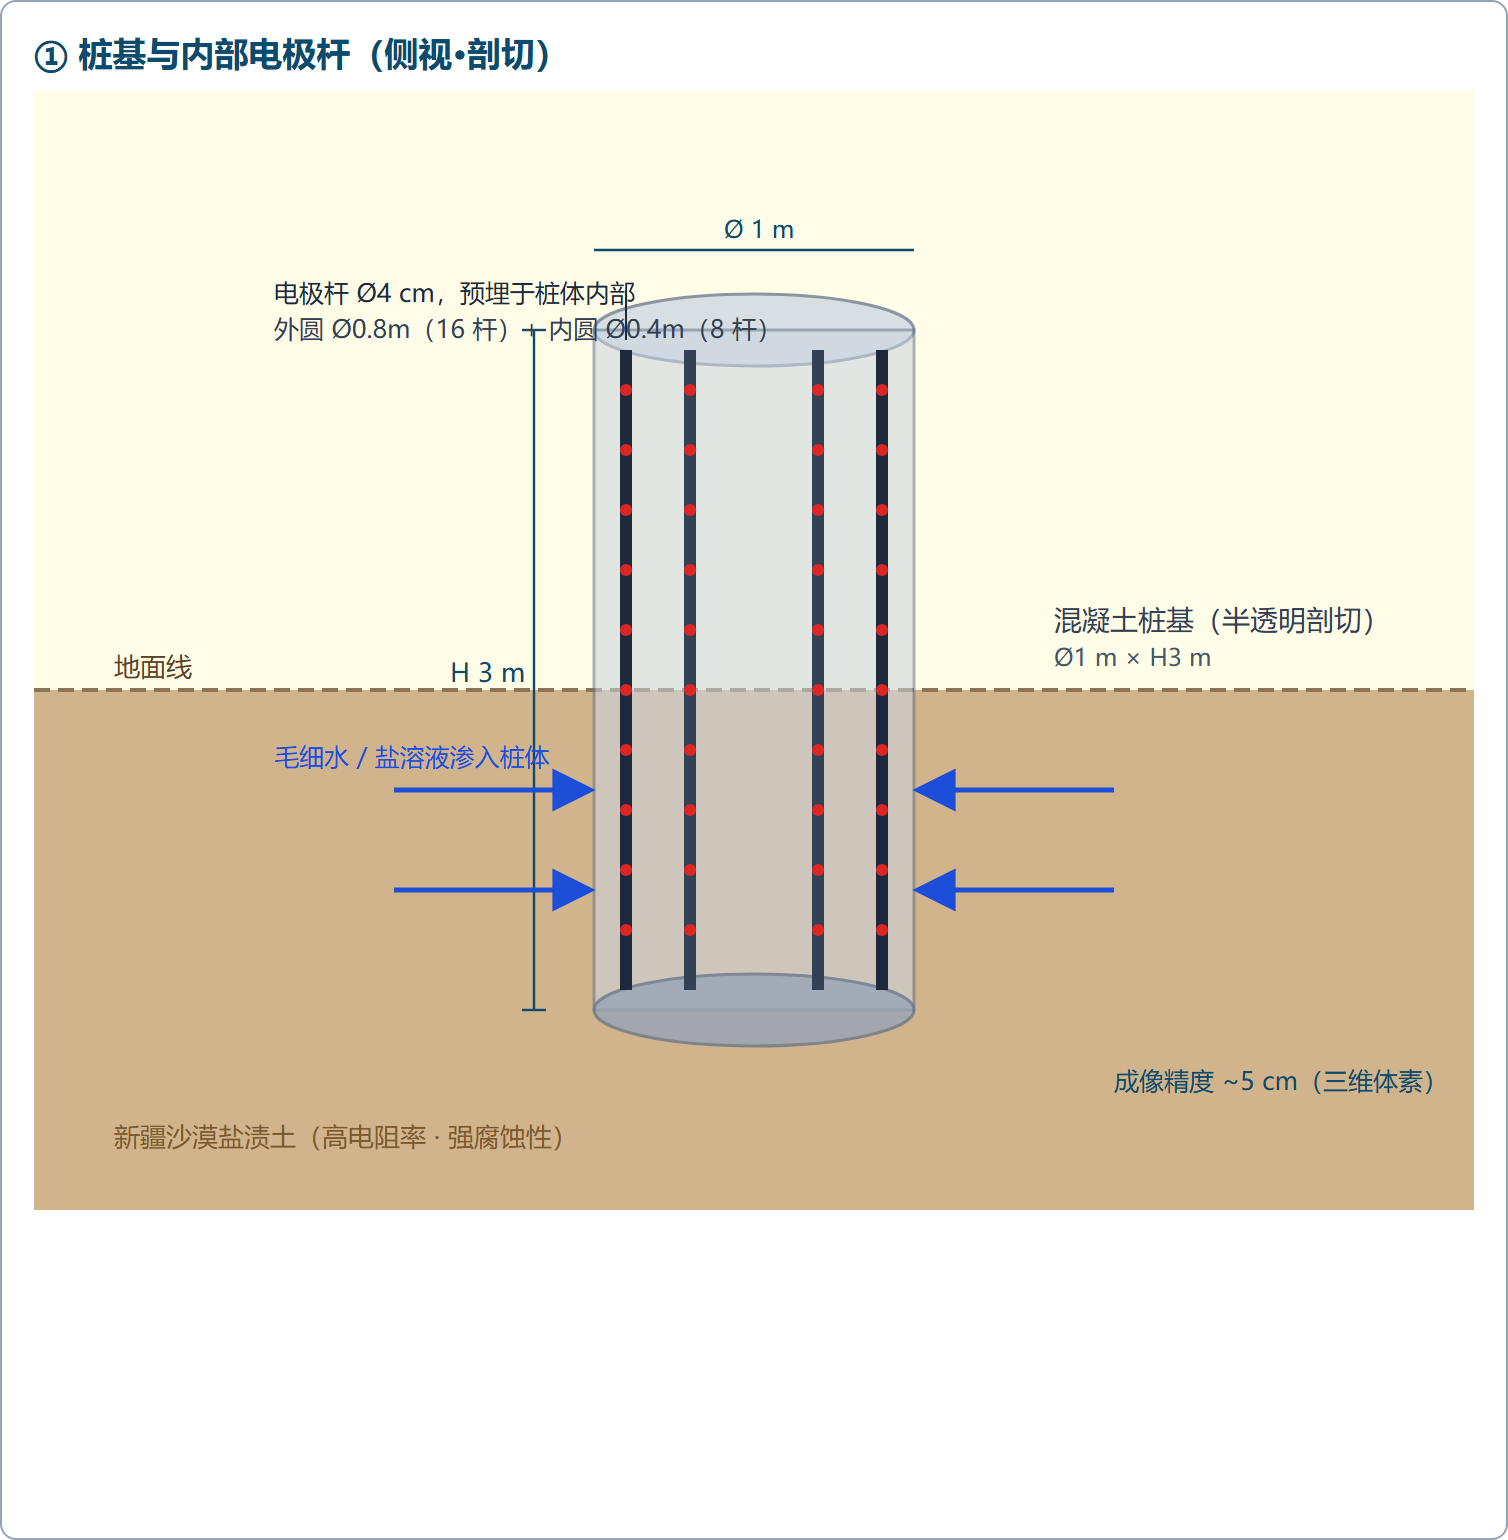
The capability of ERT for concrete imaging extends naturally to long-term non-destructive monitoring of large concrete pile foundations. Below is a representative scenario for the Xinjiang desert environment.
Monitoring objective
Reproduce the process by which capillary water seeps from the surrounding saline soil into the pile interior; quantify the moisture-diffusion range at different times and depths; reveal the deterioration pattern under long-term wet–dry cycling coupled with saline-soil attack — providing key data for pile durability assessment, remaining-life prediction and maintenance optimisation.
System configuration
- Pile: Ø1 m × H3 m concrete pile
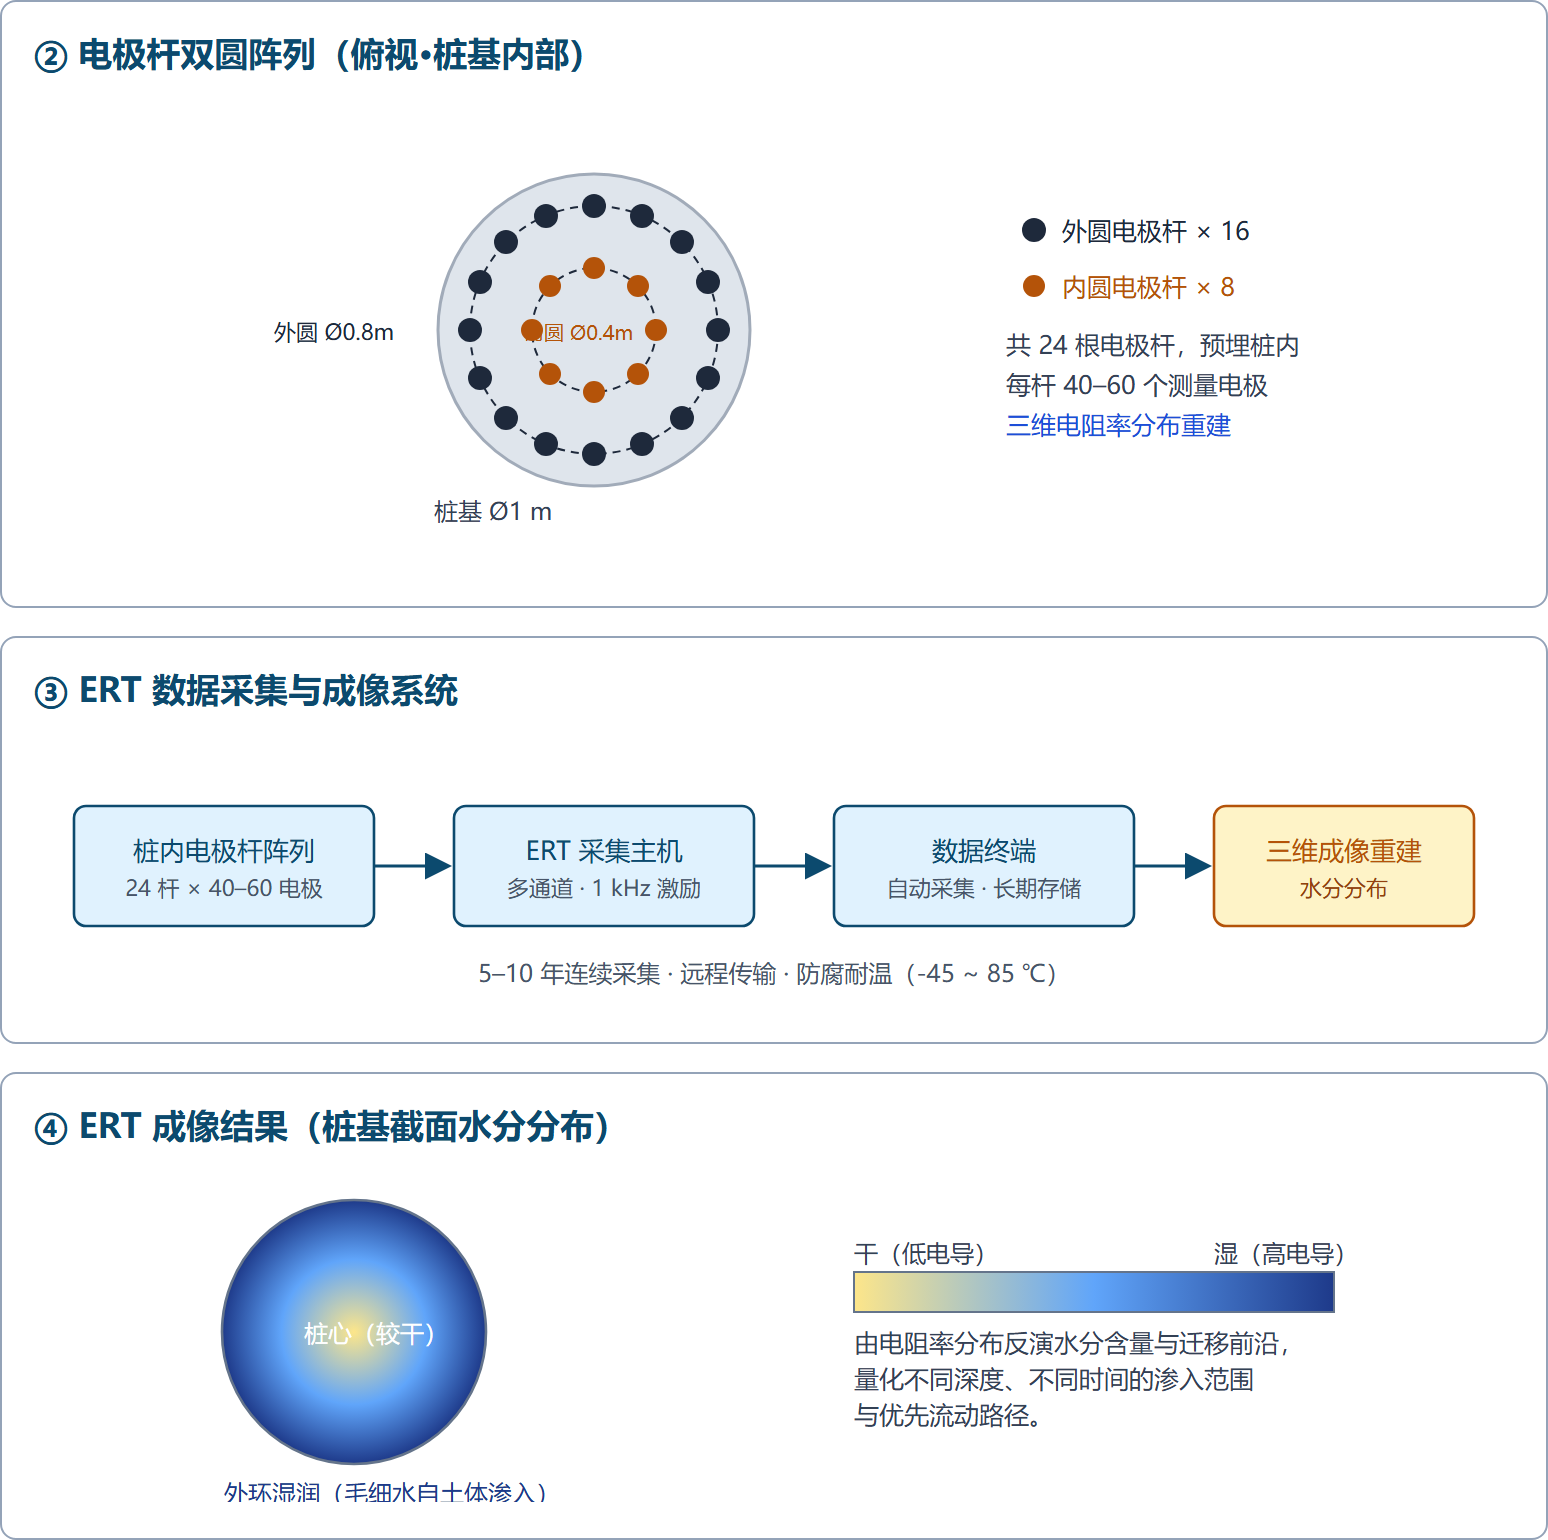
- Electrode layout: rods pre-cast inside the pile in two concentric arrays — outer Ø0.8 m × 16 rods + inner Ø0.4 m × 8 rods (24 rods in total)
- Electrodes per rod: 40–60; rod diameter Ø4 cm
- Imaging resolution: ~5 cm (3D voxels)
- Monitoring period: 5–10 years of continuous operation
Environmental challenges
- Extreme temperatures -45 to 85 °C, diurnal range up to 20 °C
- Annual rainfall below 100 mm, evaporation about 50× rainfall, very high soil resistivity
- Highly saline soil, strongly corrosive
- 5–10 years of continuous monitoring demands extreme long-term reliability of sensors, cables and data transmission
By continuously acquiring the 3D resistivity distribution inside the pile over the long term, ERT inverts the moisture content and migration front and tracks preferential flow paths — offering a non-invasive, long-lived technical route for durability assessment of pile foundations in extreme environments such as deserts.
IX. Further reading
Based on: K. Karhunen, A. Seppänen, A. Lehikoinen, P.J.M. Monteiro, J.P. Kaipio. Electrical Resistance Tomography imaging of concrete. Cement and Concrete Research 40 (2010) 137–145. doi:10.1016/j.cemconres.2009.08.023